The Stars and Beyond (Part 2)
HOW DO THEY KNOW THAT?
- Last Updated On:
HOW FAR ARE THE STARS?
This is a question that scientists have always been trying to answer, and is so difficult simply because they are so far away and appear to be at an infinite distance, because they don’t appear to move relative to each other. This caused the ancients to assume that they were fixed on a sphere. When it was realised that they were all like our sun, and they all occupied specific positions in space, people tried to calculate the distances to them.
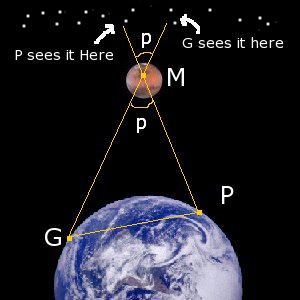
If you have read the previous article you will understand the principle of parallax- that objects appear to be in different places on a background if the position of the observer changes. Hold out your finger in front of you and cover each eye. Your finger appears to jump about- this is an example of parallax. The angle that it appears to move through is called the angle of parallax.
The greater the ratio between the distance to the object and the distance between the two observing points the smaller the angle and thus the harder it is to detect and measure.
The picture on the right shows how this method can be used to calculate the distance to Mars. It can be calculated by considering the very large, tall thin triangle with the radius of the Earth as the base:
Once θ is measured and since r is known (the radius of the Earth) d, the distance to Mars, can be calculated.
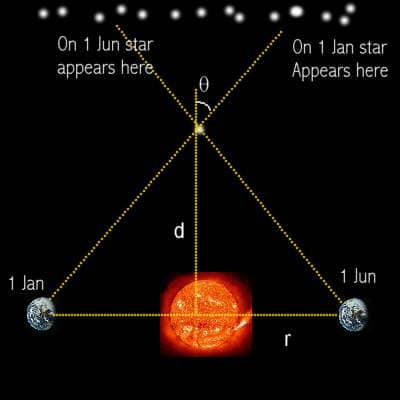
How can we use this method to calculate the distance to the stars? The distances we are dealing with are so fantastically incredibly unbelievably huge the radius of the Earth is too small as a baseline- the angle of parallax is too small- we need to go much bigger. The Earth orbits at 150 million km (see previous article to find out how they knew this in the olden days) so after six months it is 300,000,000 km from where it was before.
This is the biggest baseline we can use, forming an enormous tall, thin triangle all the way to a distant star (see diagram on the right), and then calculate the distance with the same formula as above.
William Herschel in the 18th century to tried to measure this parallax, but couldn’t- it was just too small.
As methods progressed however, these tiny angles could be measured, and the distances calculated. The largest angle of parallax belongs to Alpha Centauri (and is therefore the closest star). It is just 0.76 arcseconds- that’s only about 1/5000th of a degree!
Using the formula, lets work out how far away Alpha Centauri is:
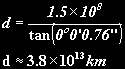
Give or take a little bit- remember the smallest error in the angle can make a quite large error in the distance. A star at a distance of 3.26 light years (that’s the distance light travels in a year) would have a parallax of 1 arcsecond This gives rise to a new unit- the parsec meaning “a parallax of one arcsecond“.
There is a satellite in orbit called HIPPARCOS, which measures stellar parallaxes all day (well actually all night). It can measure parallaxes down to 0.001 arcsecond, that’s 1/3600000 of a degree! In theory that’s up to 10,000 parsecs, but in reality we can only rely on this method up to 100 parsecs away. HIPPARCOS has accurately calculated the distance to 120,000 stars in our galaxy, and up to 2.5 million with a lesser degree of accuracy.
So what about further out than 100 parsecs? Well, we need to rely on data obtained for the nearby stars and what they tell us. I’ll come back to this question in a minute. It’s convenient to answer this question first:
Table of Content
HOW BRIGHT ARE THE STARS?
HOW MUCH ENERGY DO THEY GIVE OUT?
Lets clear up first, by brightness I mean luminosity, that’s energy per second given off. As the distance from the radiant source (the star) increases, the flux energy, that is, the energy per unit area decreases. They are related by the equation:
This because the greater distance you go from the source, the larger area the energy has been spread over. This is useful because it says that if we know how bright it looks (F, Flux, which is measurable) and how far away it is, we can tell how luminous it actually is.
An early method of measuring the luminosity of the sun was to put an oil drop on a piece of paper , so that it was translucent. If it is held up to the sun, and a light source of known Wattage is placed on the other side, and it is set at a distance from the light source so that the oil droplet and the surrounding paper are observed to have the same brightness, then the flux from the sun is roughly equal to the flux from the light source.
Knowing the ratio between the distances, can tell us how much brighter the sun actually is than the light source. We were very surprised in our Physics class when the figure we calculated turned out to be exactly right, that is 4×1026 Watts. Thus, in answer to the second question, it gives out 4×1026 Joules of energy per second, that’s 4,000,000,000 big Hydrogen bombs per second or enough energy to keep the USA going for a 40,000,000 years! (That’s in one second remember!)
There are obviously more sophisticated ways of measuring flux now, but the principle is the same, if we know how far away it is (which we do from parallax for nearby stars), and we measure how much flux we receive from it, we can calculate its luminosity or brightness.
HOW HOT ARE THE STARS?
Something else we can work out about stars, simply by looking at them is their temperature. When something gets very hot, it glows. You can see this when a blacksmith heats metal- it glows red, then yellow, then white. If you could carry on heating it up, we would see it turn blue. We can measure the spectrum of light these objects give off, and relate it to its temperature. This sort of radiation is called black body radiation- energy radiated due to a object’s heat.
For most things the spectrum peaks in the Infra-red range of light; the extremely hot metal’s spectrum in the blacksmith’s forge peaks in the red or yellow range. Its reasonable that the same goes for stars, we can observe their colour- or more exactly measure their black body radiation spectra and relate it to a general spectrum for a particular temperature measured here on Earth.
The Sun’s spectra, for example, closely approximates an object at 6000K (K is Kelvin, 1K=1°C but the scale is set so that 0K=-273°C). Wien’s law relates temperature to the wavelength where the spectrum peaks:
The sun emits most at a wavelength of 500nm (500×10-9m), so has a surface temperature of:
The same method can be applied to stars by analysing their spectra.
BACK TO “HOW FAR ARE THE STARS”
The luminosity formula is useful in reverse- if you know an objects luminosity and the flux that we receive, we can calculate how far away it is. The principle is that if we see a star to be so bright, and we know how bright it really is, we can work out how far away it is to make it appear the brightness that it does; whether its a dim nearby star, or a far-away bright star.
How do we find out an objects true brightness? From our observations of nearby stars, there are some types of star which have a particular luminosity. If we can identify distant stars of the same type, we can estimate their luminosity (similar to the nearby ones) and therefore calculate the distance to them.
This method is called using “standard candles”, because these stars are “standard” of known and specific brightness, so if we can identify them, we can immediately work out approximately the distance to them (note the assumption in this method that these “standard candles” have the same brightness- this introduces a considerable error margin into the calculated figure, however, taking averages of lots of standard candles in a cluster can reduce this error.) Some standard candles include:
Cepheid Variables. Henrietta Swan Leavitt discovered in 1904 that the time period of a type of star called a cepheid variable, (which varies in brightness over a regular period) is directly related to its luminosity. Thus if we identify a cepheid variable (don’t ask me how the know its a cepheid and not some other sort of variable star) and measure it’s time period (the time for one cycle of brightness), we can calculate its luminosity.
Main Sequence stars. What is the main sequence I hear you cry? Well, Scientists started to notice a relationship between surface temperature and luminosity (as described above), and plotted it on a graph. Mr Hertzsprung and Mr Russell pioneered this technique so it’s called, surprise, surprise, a Hertzsprung-Russel Diagram. Here are some stars for which temperatures and luminosities are known plotted in such a fashion:
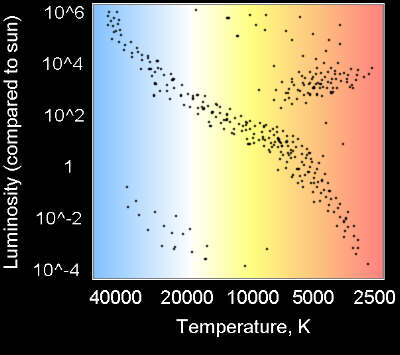
Note that most of the stars lie in very specific areas. The line down the middle is known as the main sequence, where most stars (including the sun) fit. The top right group are red giants, and the bottom left white dwarves. In reality it is a bit more complicated, with countless subgroups of different types of stars.
Light from stars on the main sequence all have the same signature in their spectra. Light from the star is split into different colors and compared to light from samples of chemicals here on Earth. From this we can determine the composition of the star, and stars on the main sequence all have similar composition.
So, we’ve looked at a distant star and calculated it’s surface temperature (the x-axis on the HR diagram) from the above method (How hot are the stars?). We can also see that it belongs on the main sequence from it’s spectrum. So we can look up from its temperature on the HR diagram and read off it’s luminosity (with some error margin, as the main sequence isn’t a perfect thin line).
There are other standard candles which I won’t go into, I’m sure you get the idea. Bear in mind as well that if stars are in a cluster, and are therefore all at a similar distance from here we need to find just one standard candle in the cluster and we know the distance to all the other stars in the cluster.
The distances to vast numbers of individual stars in our galaxy can now be calculated (all the individual stars you see by the way are in our galaxy). So what about beyond our galaxy…?
SOME OTHER THINGS WE CAN NOW WORK OUT:
Before I leave individual stars just a quick note that we can apply some of the a earlier methods for finding sizes of distant objects to star clusters. Now we know the distance to them, by measuring their angular size (sizes of stars themselves cannot be calculated this way- they are too far away)we can work out their actual size. This is how they can tell some star clouds and clusters are light-years wide!
Also, there are lots of other relationships on the HR diagram that tell us about stars: their mass and size in particular- there are relationships between mass, temperature and luminosity, and size, temperature and luminosity which show up on the HR diagram. I’m not going to go into this now, if you want information in more detail see this useful page on the HR diagram.
So, now we have found (albeit with some uncertainty due to the inaccuracies, limitations and assumptions of the methods) the mass, size, luminosity, surface temperature and distances of millions of stars in our galaxy! I think that’s pretty good seeing as all we started out from is a bit of basic geometry!
HOW FAR AWAY ARE GALAXIES?
The same “standard candle” method can be used on galaxies. Cepheid variables are quite bright so can be picked up even in other galaxies. The above methodcan be used to calculate the distance to the whole galaxy. Another standard candle useful in galaxies are type 1a supernovae. This is when a star of a particular type dies spectacularly, letting out so much energy that it can briefly outshine it’s whole galaxy.
These are rare events, but as there are so many stars in galaxies, they happen regularly somewhere in some galaxy out there. Scientists reckon that Type 1a Supernovae have a fixed maximum luminosity, so once one is identified (by its spectrum) we can use this known luminosity to calculate an estimated distance to the galaxy.
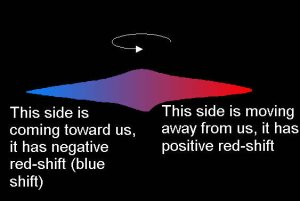
This method works until the galaxies get so far away we can’t pick up these stars. So how do we work out distance to far-away galaxies? Edwin Hubble (yes folks, he had a telescope named after him) was analysing some galaxy spectra, and noticed that the peaks and troughs matching elements on Earth didn’t occur at exactly the same wavelengths- they had been shifted toward the red end of the spectrum (you’ve probably heard of red-shift– more about it later). He theorised that this redshift is caused by the source moving away from us, an effect known as the doppler effect.
You have probably heard when a car is approaching you quickly it’s engine sounds high pitched, then when it goes past and is therefore moving away, it sounds low pitched. This is because when an object’s coming toward you, waves emitted from it (whether sound or light) are ‘squashed up’, reducing their frequency. With light, this is shifting it toward the blue end of the spectrum, so it’s called blue-shift. When an object is moving away from you, the opposite occurred, the waves are ‘stretched out’, with light this would be a red-shift:
A simplified form of the doppler equation is:
Where v is the speed of the wave and u is the speed of the source relative to the observer, and z is doppler shift.
Going back to our situation, z is the redshift of the galaxy, u is the speed of the galaxy (which we’ll call v), and v is the speed of light, c. So the speed of a galaxy moving away from us is:
Hubble calculated the distance to lots of nearby galaxies (using cepheid variables) and also measured their redshift, thereby calculating their velocity. He plotted a graph of velocity against galaxy distance for nearby galaxies, and found that speed of recession is directly proportional to distance:
Where v is speed, d is distance and H0 is a constant known as the Hubble constant- a hugely important number, which we’ll come on to later. Combining the previous two equations eliminating v:
So now distance to faraway galaxies can calculated by measuring their redshift. In theory this gives us the distance to any galaxy in the universe. However, its not really that simple- we’ve made a large assumption that this linear relationship applies throughout the whole universe.
Also, when plotted on a graph, the points for nearby galaxies aren’t in an exact straight line, so there is some doubt about the value of H0– values range from 50 km s-1 Mpc-1 to 100 km s-1 Mpc-1– a factor of two which is quite a large uncertainty (although Hubble- I’m talking about the telescope now, not Edwin Hubble- recently measured it to be about 70 km s-1Mpc-1 to an accuracy of 10 percent which is a great improvement).
HOW HEAVY ARE GALAXIES?
Remember how we found the mass of the Sun and Jupiter on the first page- using the equation for gravity and circular motion for it’s orbit. The Mass of a central object orbited by some satellite is given by:
Galaxies rotate- we can easily measure the speed of this rotation of a side-on galaxy (allowing for the galaxy’s overall red-shift and taking it as fixed) as the stars on one side are moving toward us, and the stars on the other side are moving away from us. We can calculate the speed of either side, and thus calculate it’s rotation speed.
We can also easily work out the size of the galaxy by measuring its angular size, and, knowing the distance, we can calculate it’s size. Taking an individual star near the edge, we can work out it’s speed and distance from the center, and put it into the formula (as the satellite), and calculate the mass of all the material inside it’s orbit, which is most of the galaxy (the central object).
This leads on to the matter of dark matter. When astronomers do these sums they find that the galaxy is far too heavy for the amount of matter we can see- the stuff that’s luminous, radiating light- by some estimates 90% of the mass in the universe is missing!. Thus they infer that there must be some “dark matter” matter that doesn’t radiate at all.
There are several suggestions for the nature of dark matter; black holes, brown dwarves, neutron stars, WIMPs (weakly interacting massive particles), MACHOs (Massive Compact Halo Objects- that is matter in the ‘halo’- the mass surrounding the central part of a galaxy) and kinds of other crazy stuff, but I’m not going to really going to go into that, as I’m digressing (if you want more information about dark matter here’s a good page)
HOW OLD IS THE UNIVERSE?
OK, the big one- the age of the universe. When Hubble showed that all the galaxies in the universe are receding from us, he realised that this indicates that the universe is expanding. If its expanding, the further back in time we go the smaller the universe is, and since this rate is constant it must have had zero size at some point- the universe must have had a beginning, a start point, an instant of creation. How long ago was this? Well, since:
And if a galaxy’s speed is constant, the distance it has traveled after time t at speed v is:
Putting these two together to eliminate d, v also cancels out leaving:
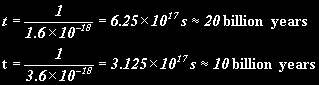
Therefore the time that the galaxy has been moving for, t, i.e. the age of the universe, is:
Isn’t that neat? I told you H0 was important. However, this has its limitations- it depends on the value of H0, the value of which as I mentioned earlier is in doubt. Here’s the calculation using the upper and lower bounds for H0 (in s-1):
This gives us an order-of-magnitude estimate, but clearly, we can’t know for certain. Remember also that it is also based on assumptions about the motion of galaxies and the expansion of the universe, about which it is difficult to know for certain whether these are correct. Astronomers are currently working on more reliable ways to find a figure for the age of the universe, usually involving observing very distant galaxies at the edge of the universe- you may have seen the famous deep-field Hubble picture:
These galaxies are so far away that light has taken billions of years to get here, so we see them as they were billions of years ago, near the beginning of the universe.
Astronomers get more idea of what the early universe was like by studying such photographs. More accurate estimates of H0 are being sought as well to give more reliable estimate the age of the universe (as I said Hubble has recently obtained a figure to within 10% accuracy). Current estimates of the age of the universe are round about 15 billion years, but this is constantly being revised.
There you go- hopefully now you understand where astronomers get some of their figures from. Remember, though the limitations of the experiment- very little, if anything, is proven in astronomy- all we can do is look up from this one point is space and gather what evidence we can, speculate on, theorise, and infer information from this evidence. We certainly don’t know it all at the moment, there’s still (and will always be) a lot more out there to learn!
SUBSCRIBE TO OUR WEEKLY NEWSLETTER